
Using the dashboard
The dashboard is the controller's console. Open it in a browser on the controller machine, at the admin address printed when the controller starts, for example `http://127.0.0.1...
The dashboard is the controller's console. Open it in a browser on the controller machine, at the admin address printed when the controller starts, for example http://127.0.0.1:9444/. Starting the controller is in controller-installation.md. Command-line equivalents of these actions are in controller-administration.md.
The page refreshes every 4 seconds. Ages on the probe pane tick every second. A field you are typing in is left as you left it until you save.
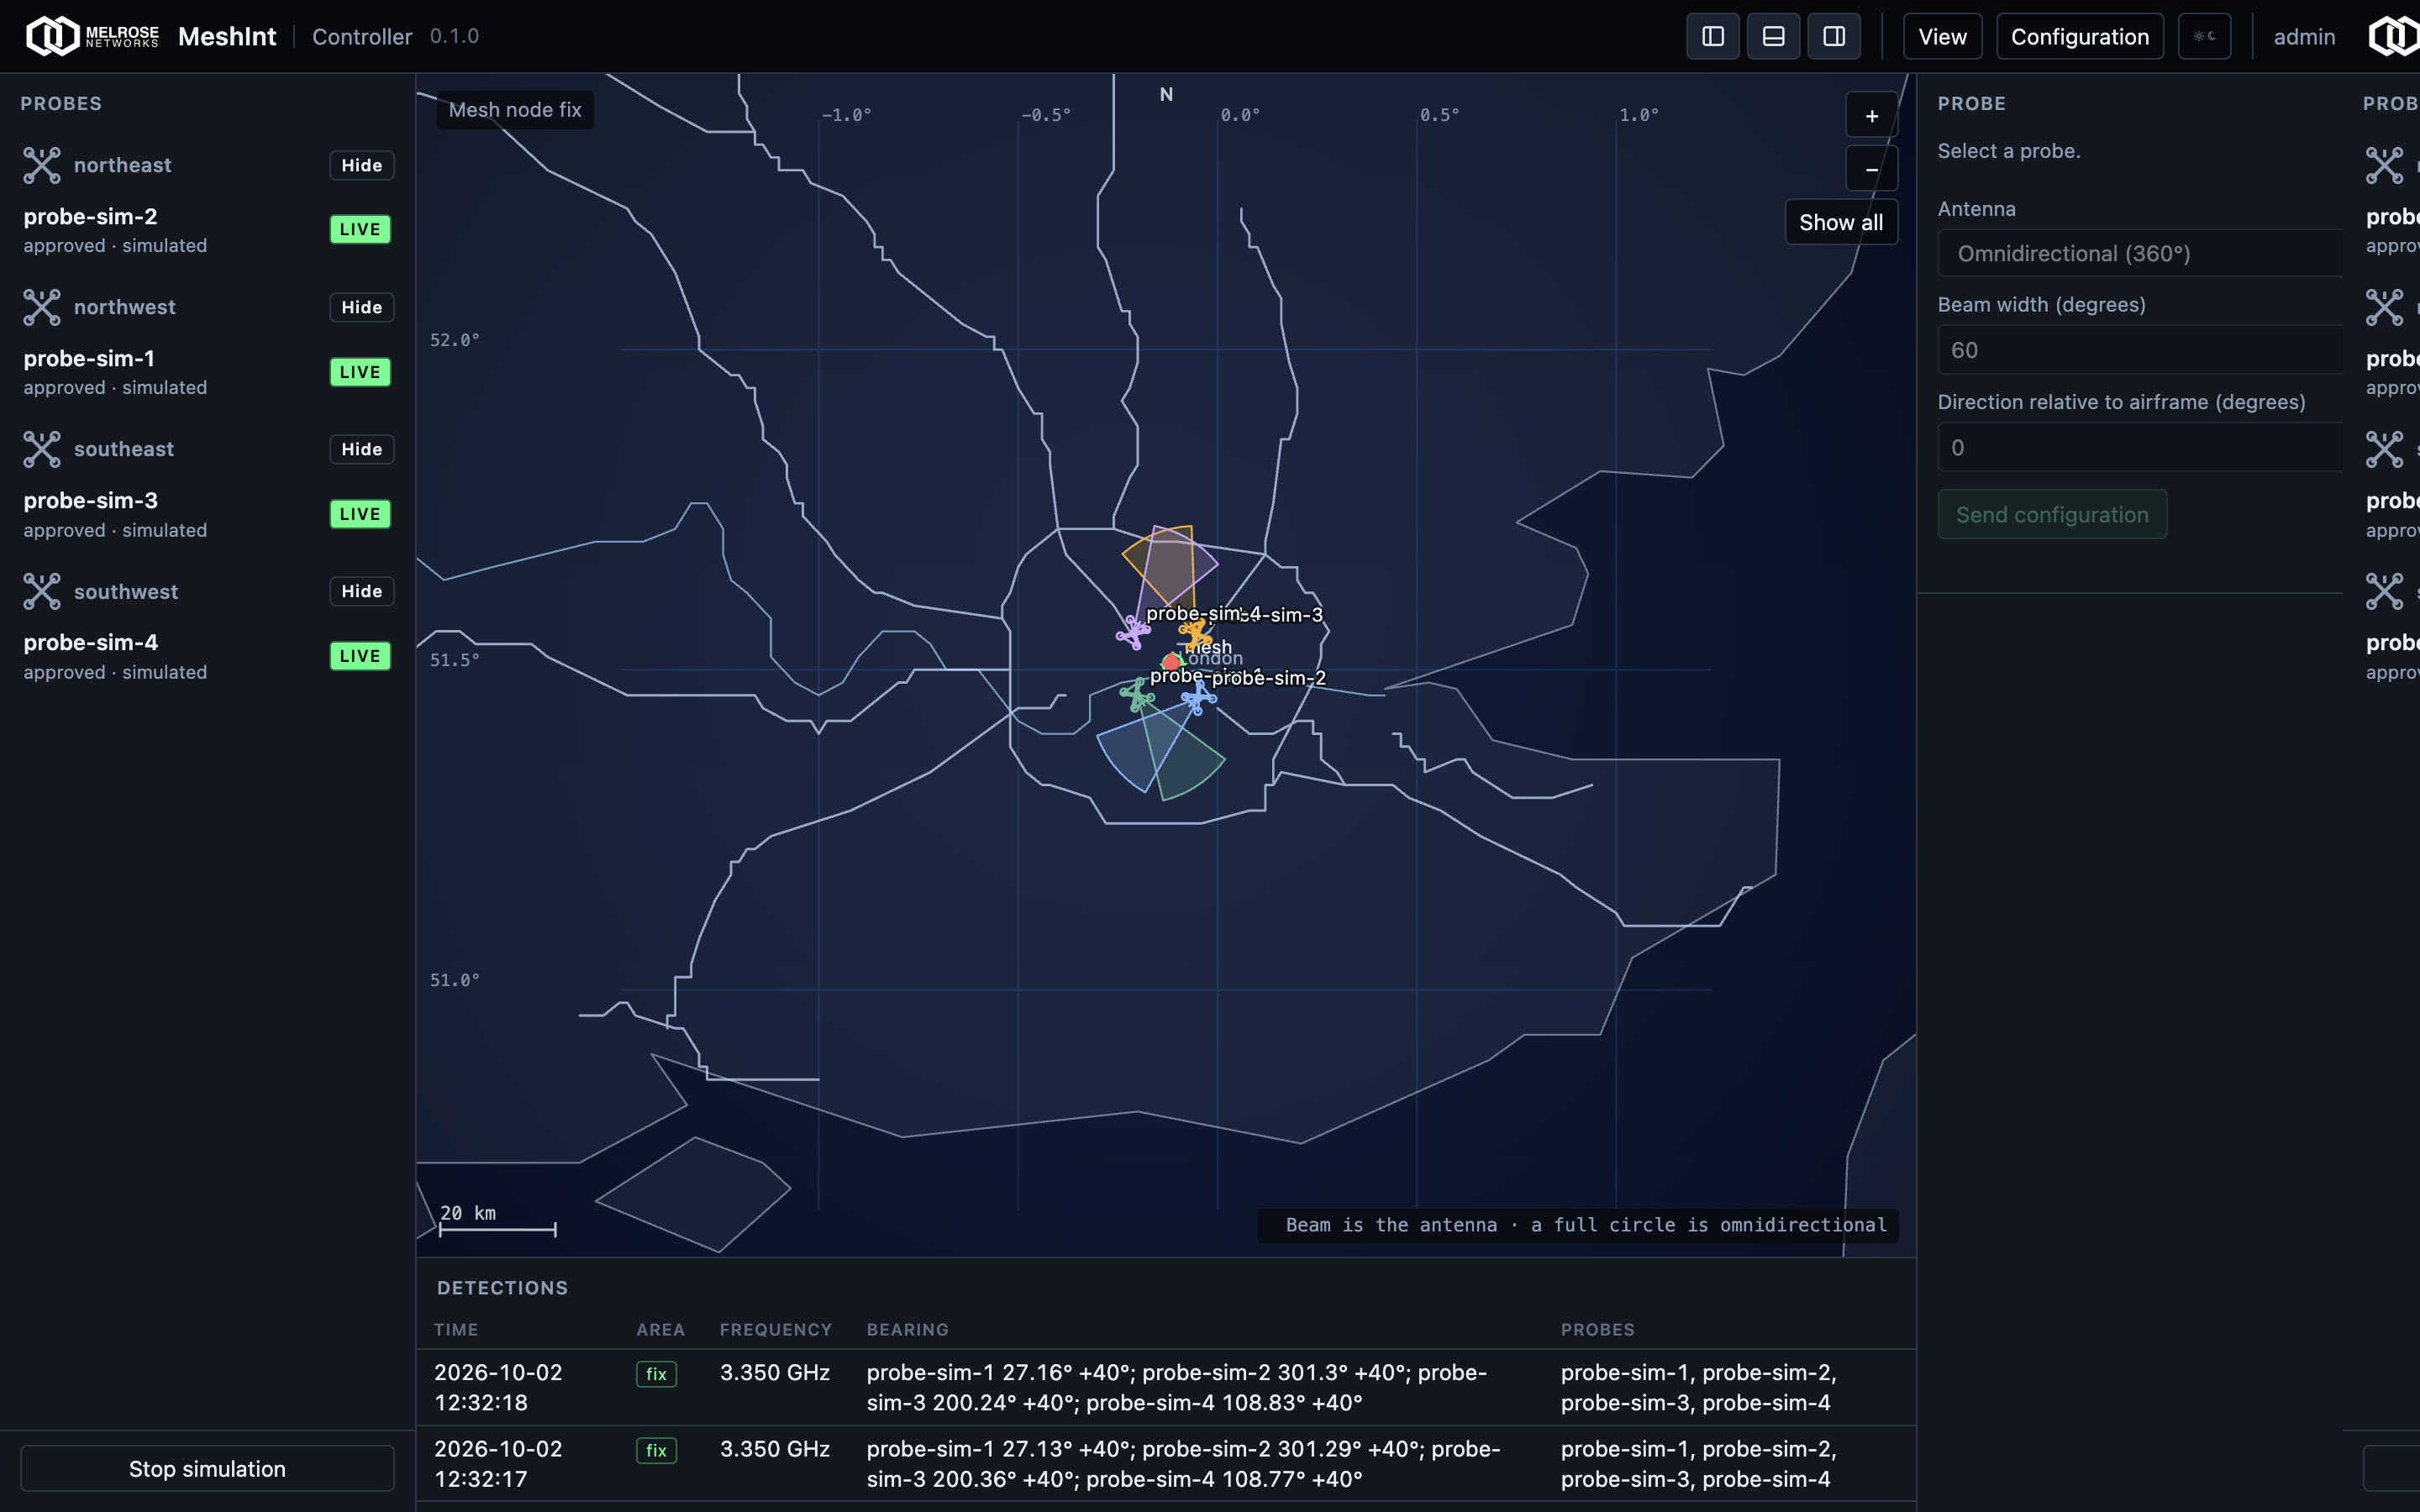
The pictures in this guide are that exercise, so the probe rows read simulated.
Header
The header runs across the top: the Melrose Networks mark, MeshInt, Controller, then the controls for this visit.
Product and version
The version sits beside Controller. Resting on it shows Controller version. That is the controller process serving this page.

Pane buttons
Three icons sit together. Each one shows or hides one area, and the tooltip names the next action:
| Icon | Shows or hides |
|---|---|
| Left bar | The probe list |
| Bottom bar | The detection list |
| Right bar | The probe pane |
The map stays. Hiding an area only changes this browser. Opening the page again shows all three.
View and Configuration
View opens the map menu, described under View. Configuration opens the settings dialog, described under Configuration. Opening Configuration closes the View menu.
Display theme
The sun or moon button switches the console. Its tooltip reads Light display or Dark display, naming the theme you will switch to. The choice is stored in this browser and is used the next time you open the page. The map, the probe marks, and the place names follow the same theme.
Session
The session name is admin. Log out covers the console, closes Configuration and View, and stops the refresh. The page then shows Signed out, with the line "The controller is still running. Open admin to return to the console." Open admin returns to the console and starts the refresh again. The controller process keeps running either way.
The layout
The probe list is on the left, the map and the detection list are in the centre, and the selected probe is on the right. On a narrow window the map sits above a shorter probe list and a shorter detection list.
Probes
The left side is headed Probes. A status line under the list reports the last action, such as an acceptance or the simulation. Simulate mesh sits at the foot of this pane.
Airframe groups
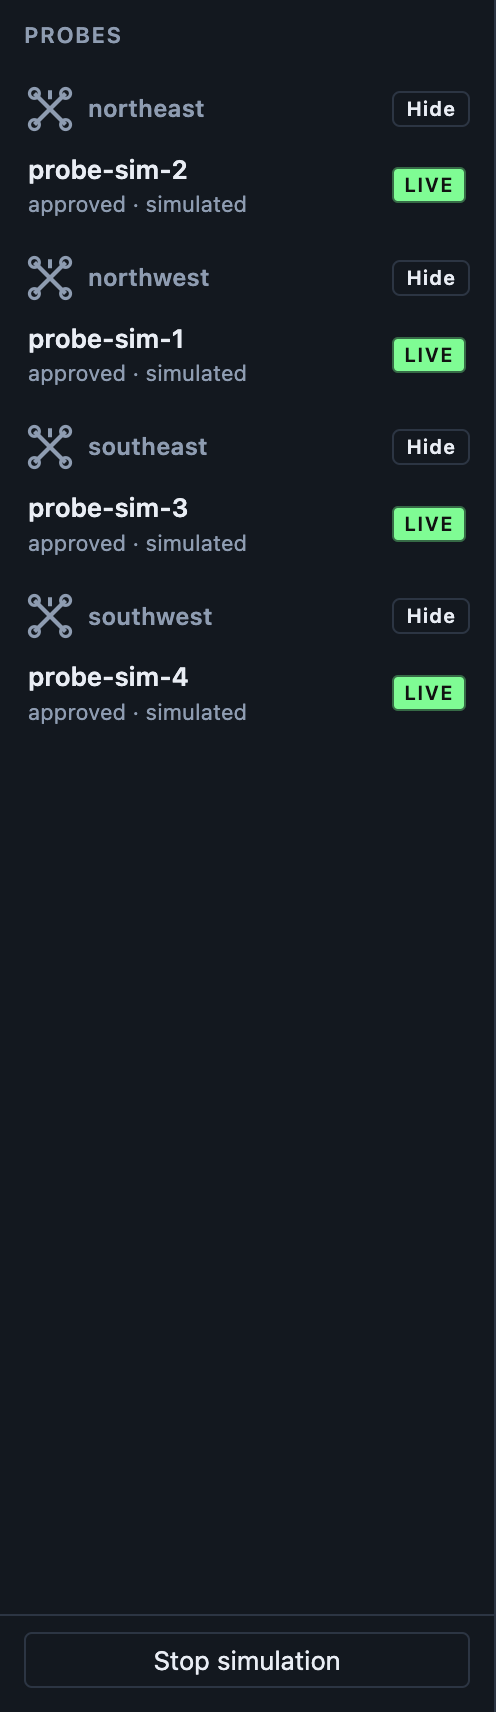
Probes are grouped by the airframe name they reported. Names are shown as reported and listed in alphabetical order. A probe with no name is listed last, under No airframe.
Once a type is saved for that name, the heading shows the aircraft icon: balloon, small fixed-wing, large fixed-wing, or multi-rotor. A description set for that airframe appears when you rest on the heading.
A probe row
Press a row to select that probe. The selected row is highlighted, the probe pane fills in, and the map moves to it when it has a position.
The bold title is the probe id after acceptance, or the host id until then. The line under the title reads approved or pending enrollment. A simulated probe adds simulated. A probe that is still pending also shows its host id on that line.
Accept
Accept appears on a pending row that has made contact. Press it. The status line reads Accepted, with the host and the airframe name when one was reported. The controller assigns probe-1, probe-2, and so on. That probe's detections then join the picture, and the antenna controls on the probe pane become available. Approval is remembered for that host, so a later connection is already approved.
LIVE
| Mark | Tooltip | Meaning |
|---|---|---|
| Outline LIVE | Alive, no recent detection | A hello arrived in the last 15 seconds |
| Solid green LIVE | Detections are being received | A detection from this probe also arrived in those 15 seconds |
A row with no LIVE mark has been quiet for more than 15 seconds. A pending probe can show the outline mark. Its reports are held until you press Accept, so that mark stays an outline.
Hide and Show
Hide on an airframe heading takes that airframe off the map and out of Show all. The heading and its rows stay, dimmed, and the button reads Show. Show puts them back. The choice lasts for this visit.
Choosing a hidden probe fills the probe pane and leaves the map where it is.
Configuration and update marks
These marks are for probes you accepted. A simulated row omits them.
| On the row | Meaning |
|---|---|
| configuration pending | A scan plan or antenna change is waiting for the probe to report it |
| update pending | A staged software update is waiting for the probe to report that version |
Resting on a row that has finished those steps shows configuration sent, update confirmed, or both, joined in the tooltip. A probe that has never been offered a configuration has neither label.
Map
The map is the wireframe in the centre. Its status line sits on the map. The tools are + (Zoom in), − (Zoom out), and Show all. The foot of the map shows the latitude and longitude under the pointer, then the legend "Beam is the antenna · a full circle is omnidirectional".
The picture
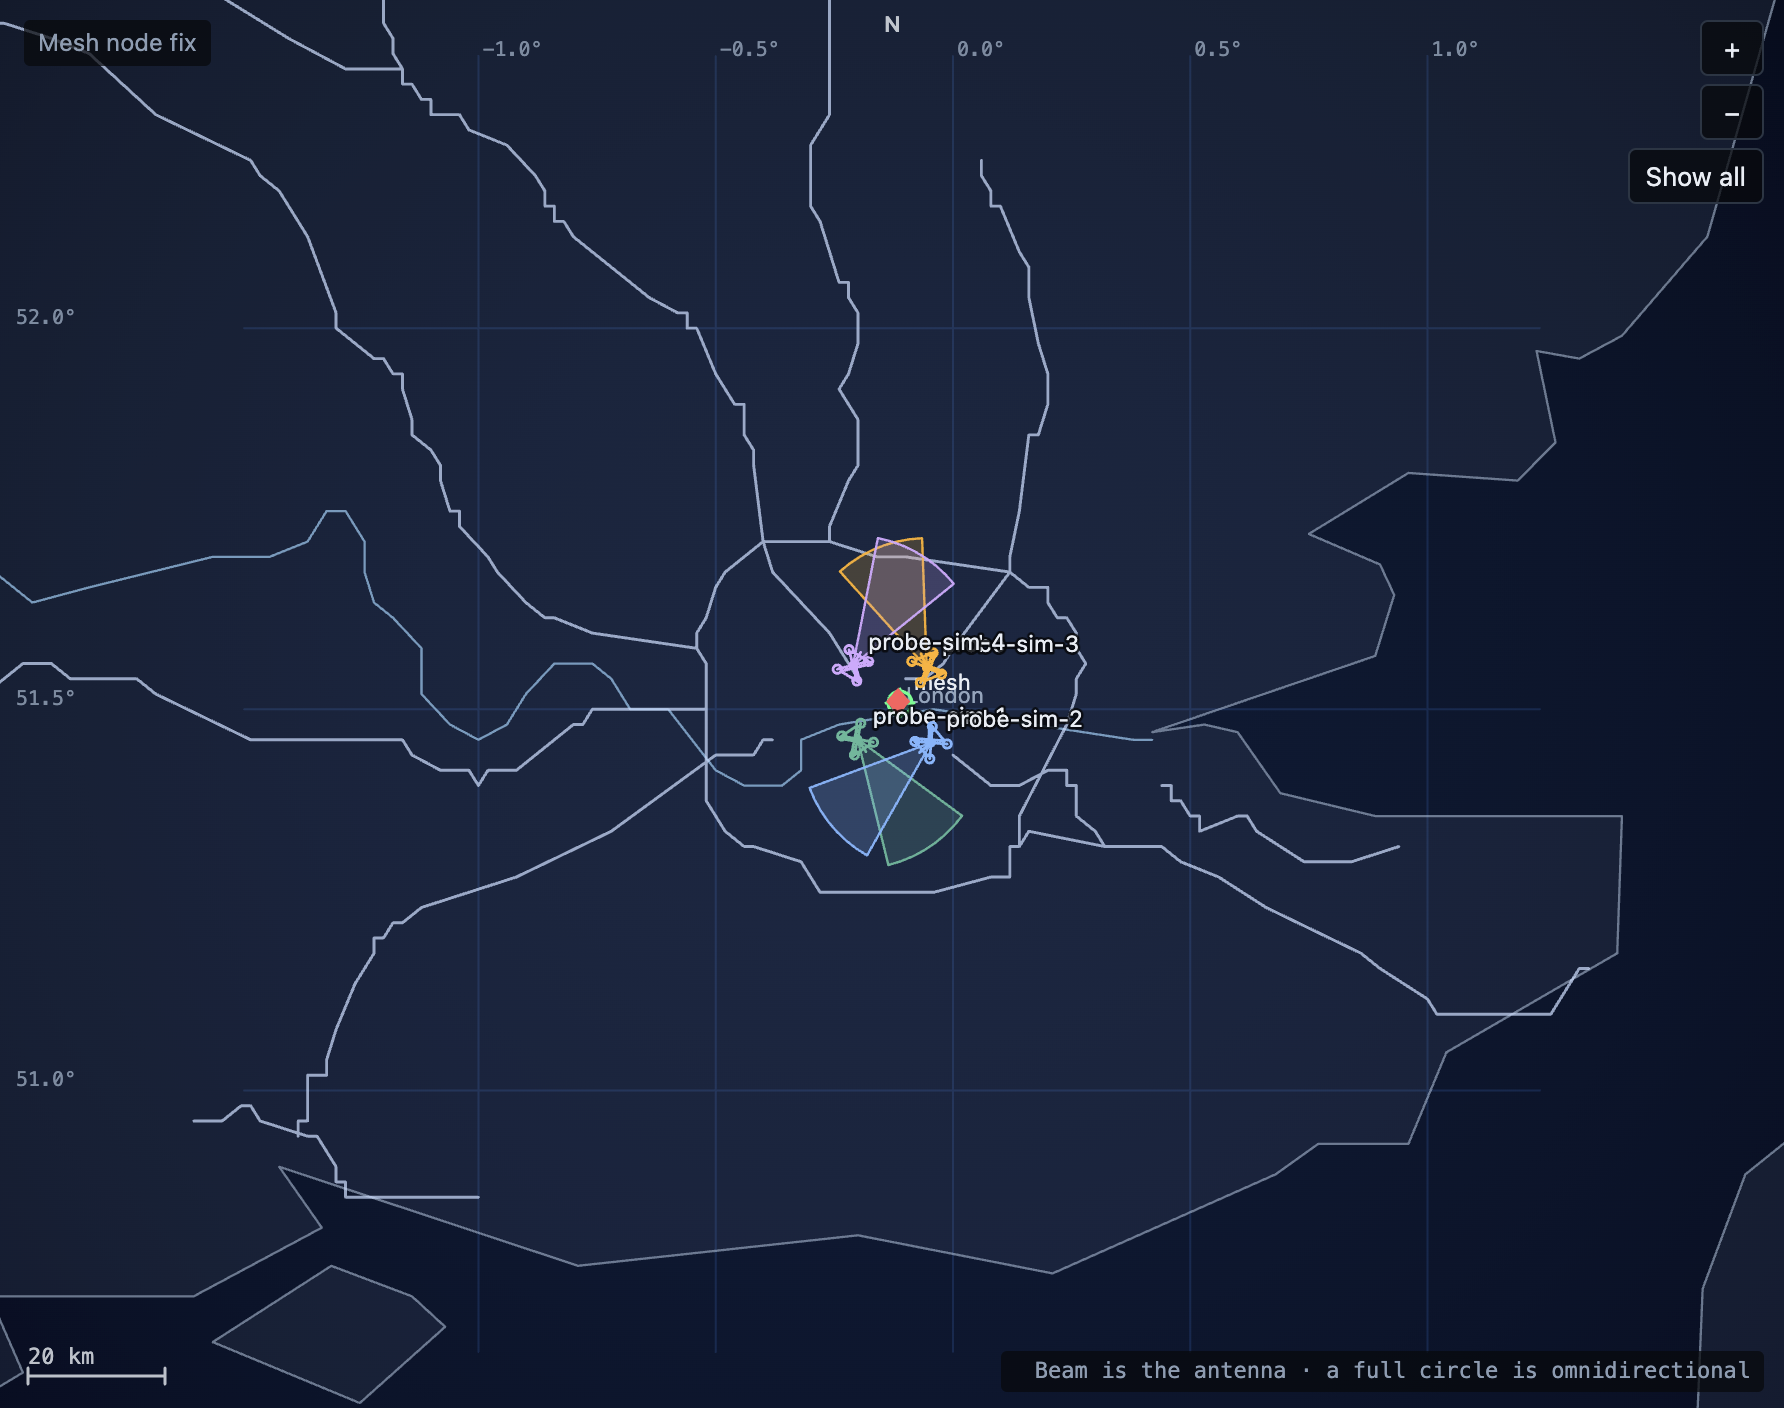
The base is a wireframe of land, boundaries, and, as you come closer, rivers, major roads, and place names. Rivers and roads appear when the view spans 25° or less, and they draw more strongly as the view gets closer. Place names appear as the view closes in, larger places first. A latitude and longitude grid is labelled in degrees, a north mark sits at the top, and a scale bar at the lower left reads in metres or kilometres.
Every probe that has reported a position, and whose airframe is shown, is drawn in its own colour. The mark is the aircraft icon for the saved type, turned to the heading the probe reported. A bracket highlights the selected probe. The label beside the mark is the probe id, or the host id before acceptance.
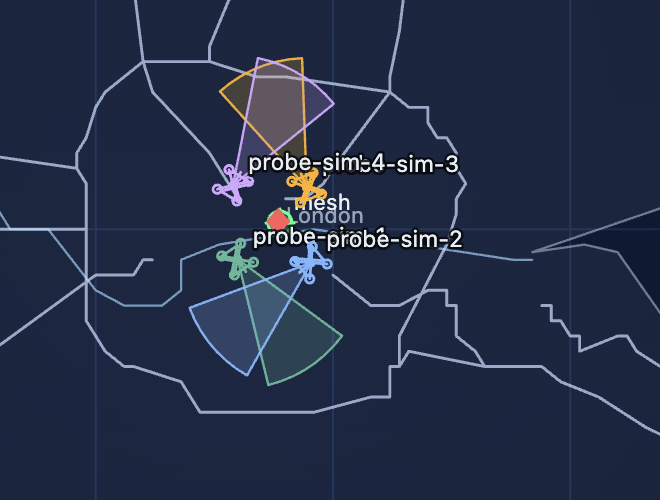
The beam drawn around a probe is its antenna. A full circle is omnidirectional. A directional antenna is a wedge: the beam width, centred on the direction relative to the airframe heading. An accepted probe is drawn with a solid outline. A probe that is still pending enrollment is drawn with a dashed outline. The marks, beams, and labels grow and shrink with the zoom. A detection area drawn for the exercise stays at its geographic size.
With no positions reported, the wireframe stays on a world view and the status reads "No probes have reported a position." The first position fits the view to the probes that are shown.
Pan and zoom
Drag pans the map. A small movement still counts as a click, so you can press a probe without sliding the view.
The wheel zooms towards the pointer. + zooms in on the centre of the map, and − zooms out. After you pan or zoom, the view stays where you left it until you press Show all or choose a probe.
The readout
The latitude and longitude under the pointer are shown to four decimal places, latitude first. Moving the pointer off the map clears that readout.
The status line names what the view is doing:
| Status | When |
|---|---|
| Showing N probes | The view is fitted to the probes on the map |
| Centred on … | You chose a probe that has a position |
| … has not reported a position | You chose a probe the map cannot draw |
| No probes have reported a position. | Nothing on the map has a latitude and longitude |
| Simulating a mesh node over London | The exercise is running |
| Mesh node … | The exercise is running and has an area label |
Show all
Show all fits the probes that are currently shown, with a margin around them. Hidden airframes are left out. The status line counts the probes in that fit. If none of the shown probes have a position, the status returns to "No probes have reported a position."
Choosing a probe
Press a probe in the list or on the map. The same probe is selected in both places. The map centres on its last position. When the view is wider than 25°, it also zooms in. A probe that has not reported a position stays in the list, and the map status says so.
Detections
The list under the map is headed Detections. It refreshes with the rest of the page.

The table
| Column | What it shows |
|---|---|
| Time | UTC, as YYYY-MM-DD HH:MM:SS |
| Area | A label: insufficient, bearing, hyperbola, or fix |
| Frequency | The centre frequency, in GHz, MHz, or Hz. Resting on the cell shows the value in Hz |
| Bearing | Each contributing probe and the sector it reported |
| Probes | The probe ids that contributed, separated by commas |
An empty list reads No detections.
Older subjects are dimmed. The live set keeps the latest 200 subjects. A subject that has left that set stays in the list, dimmed, until the retained history of 2000 is full.
Filtering
Choosing an accepted probe changes the heading to Detections · and that probe id. The table then lists the detections that probe contributed to. If it has contributed to none, the table reads No detections from that probe id. Show all, beside the heading, clears the selection: the probe pane returns to "Select a probe.", the heading returns to Detections, and every detection is listed again.
Choosing a probe that is still pending enrollment changes the heading to that host and leaves the table empty, with the line "Accept this probe before it can report detections." Show all clears that selection too.

Area
Reports from different probes join one detection when their centre frequencies are close and their times are within 50 ms. The area label is the result of that association:
| Area | What it means |
|---|---|
| insufficient | One probe heard the emission. The source is not placed. |
| bearing | A direction from a probe: a wedge of unknown length. |
| hyperbola | Two or more probes. The area follows a curve and spans more than 2 km. |
| fix | The area spans 2 km or less. The reported position is the centre of that area. |
Frequency and bearing
A centre frequency of 1 GHz or more is shown in GHz to three decimal places. A frequency of 1 MHz or more, and under 1 GHz, is shown in MHz to one decimal place. Anything lower is shown in Hz.
The Bearing column lists each contributing probe and the sector it reported. A sector of 360° is the full circle, written as the probe id and 360°. A narrower sector is the probe id, the start in degrees, and the width, for example probe-1 20° +40°. Several probes are separated by semicolons.
The probe pane
The right side is headed Probe. Until you choose one, it reads Select a probe. The antenna controls under that line stay disabled.
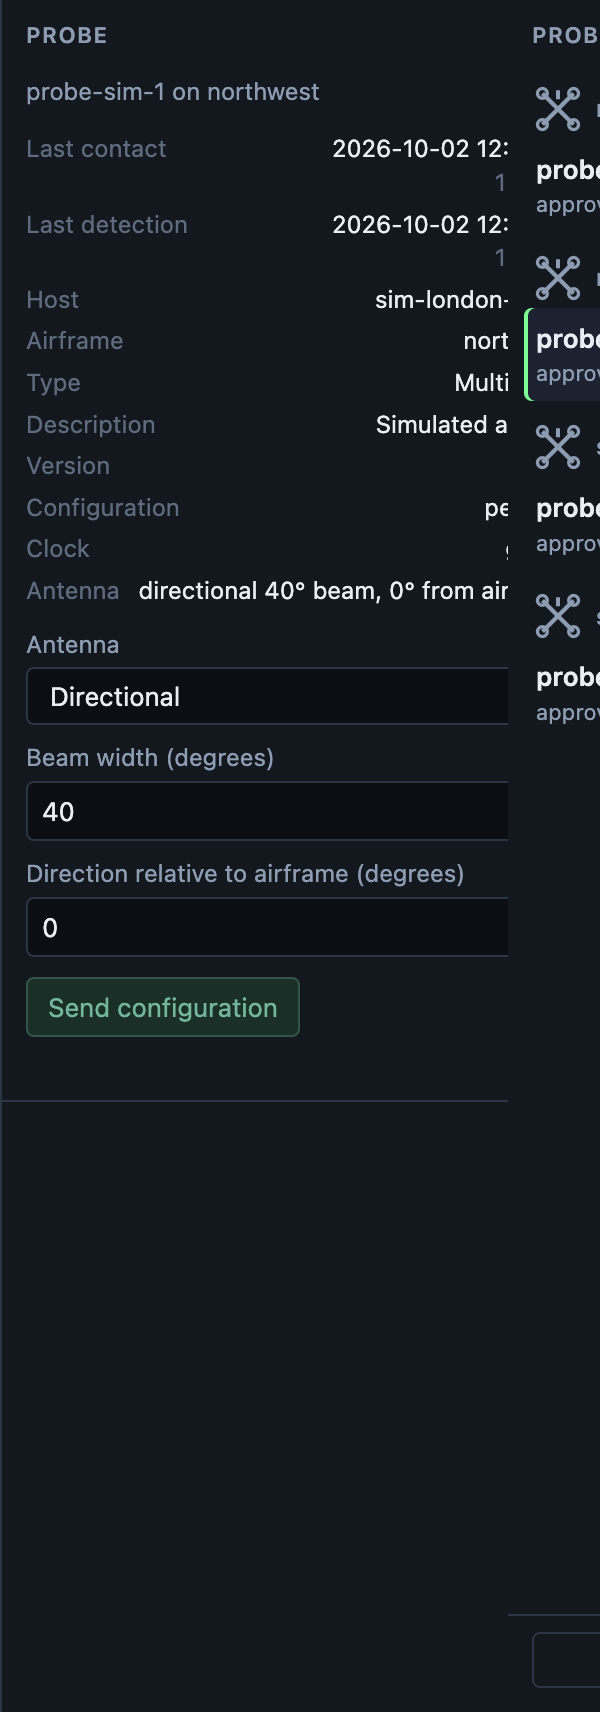
The readout
After you choose a probe, the line under the heading names it. An accepted probe reads as its probe id, and the airframe name when it reported one, for example probe-1 on north. A probe you have not accepted reads Accept, the host id, and the airframe, then "before reconfiguring."
The readout then lists:
| Line | What it shows |
|---|---|
| Last contact | UTC time of the last hello, and an age such as 12 s ago, 3 min ago, 2 h ago, or 1 d ago |
| Last detection | UTC time of the last detection from this probe, and the same kind of age. A blank is a dash |
| Host | The host id |
| Airframe | The name the probe reported, or a dash |
| Type | Balloon, Small fixed-wing, Large fixed-wing, Multi-rotor, or a dash when no type is saved |
| Description | The description saved for that airframe, or a dash |
| Version | The software version the probe reported, or a dash |
| Configuration | pending, sent, or a dash when no configuration has been offered |
| Clock | The clock the probe reported, or a dash |
| Antenna | The antenna in words, matching the controls below |
The age updates every second while the page is open.
Antenna
The controls are Antenna, Beam width (degrees), Direction relative to airframe (degrees), and Send configuration. They stay disabled until the selected probe has a probe id.
Antenna is a list:
- Omnidirectional (360°)
- Directional
Beam width starts at 60 and the direction starts at 0 when the probe has not reported an antenna yet. For a directional antenna the readout describes the beam, for example directional 60° beam, +0° from airframe. An omnidirectional antenna reads omnidirectional 360°.
Several probes that report the same airframe name are on one aircraft. Each keeps its own antenna, so they can look in different directions relative to that airframe.
Send configuration
Press Send configuration. The status under the button reads Pending for that probe id until the probe reports it, and the row shows configuration pending. A later contact that reports the change clears the row flag, the tooltip shows configuration sent, and Configuration in this pane reads sent.
Editing the antenna, the beam, or the direction keeps your numbers in place across the 4-second refresh until you send them. Send configuration on a probe that is still pending reports Accept an enrollment first.
Configuration
Configuration opens a dialog with four tabs: Airframes, Scan plan, SAPIENT, and Software update. The dialog keeps its height when you change tab. Close leaves the dialog. These settings apply on the probes' next contact. They belong to the controller, and the antenna on the probe pane is the control that belongs to one probe.
Airframes
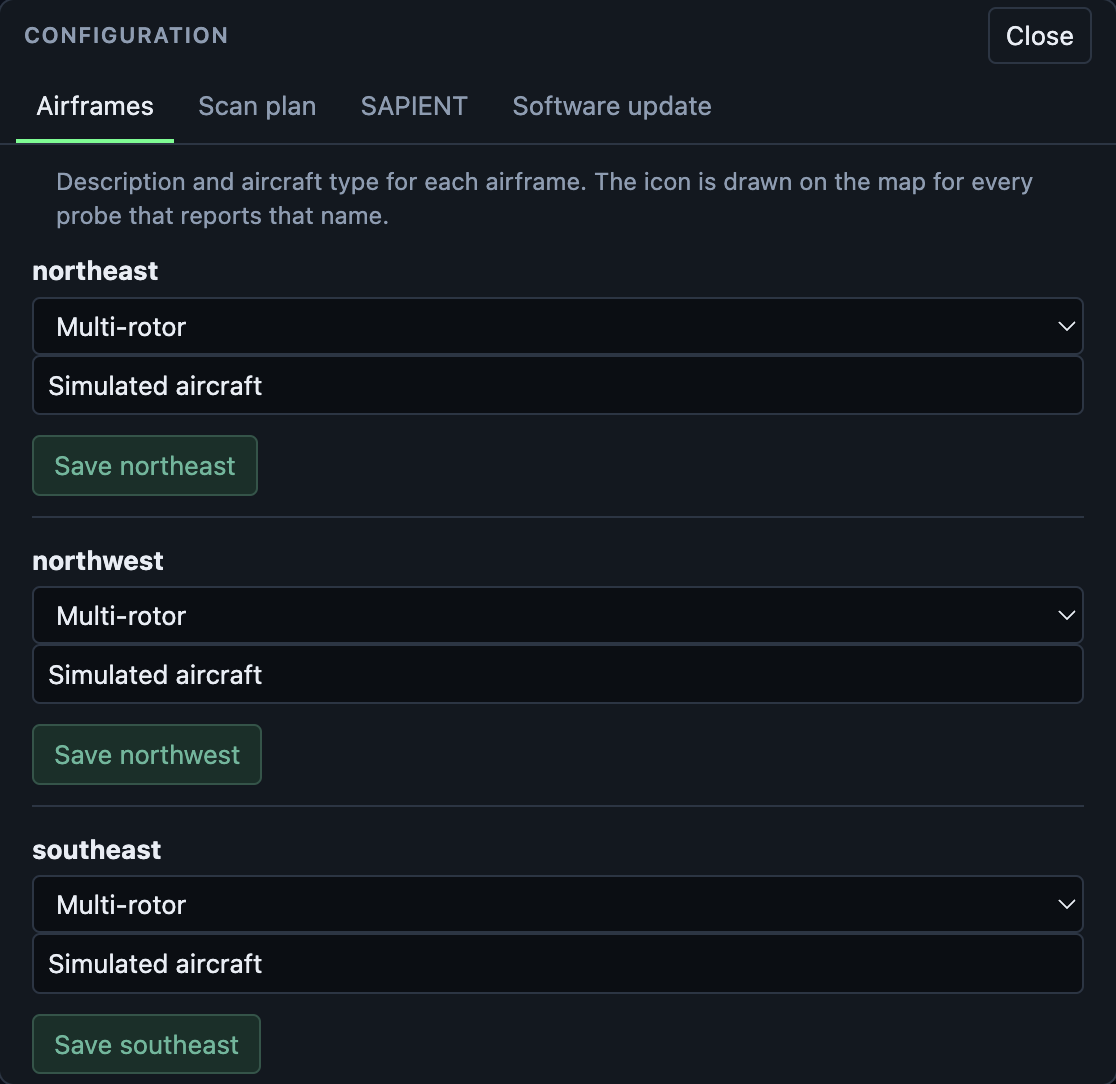
The tab reads "Description and aircraft type for each airframe. The icon is drawn on the map for every probe that reports that name."
Each name a probe has reported is a card: the name, a type list, a description, and Save followed by that name. The type list is Choose a type, Balloon, Small fixed-wing, Large fixed-wing, or Multi-rotor. The description field's placeholder is Description. Save stores that name, and the status line reads Saved and the name. The type becomes the icon on the map and beside the airframe heading.
The list stays empty, with "No airframe has been reported yet.", until a probe reports a name. While you are changing a type or a description, the refresh leaves the card as you are editing it.
Scan plan
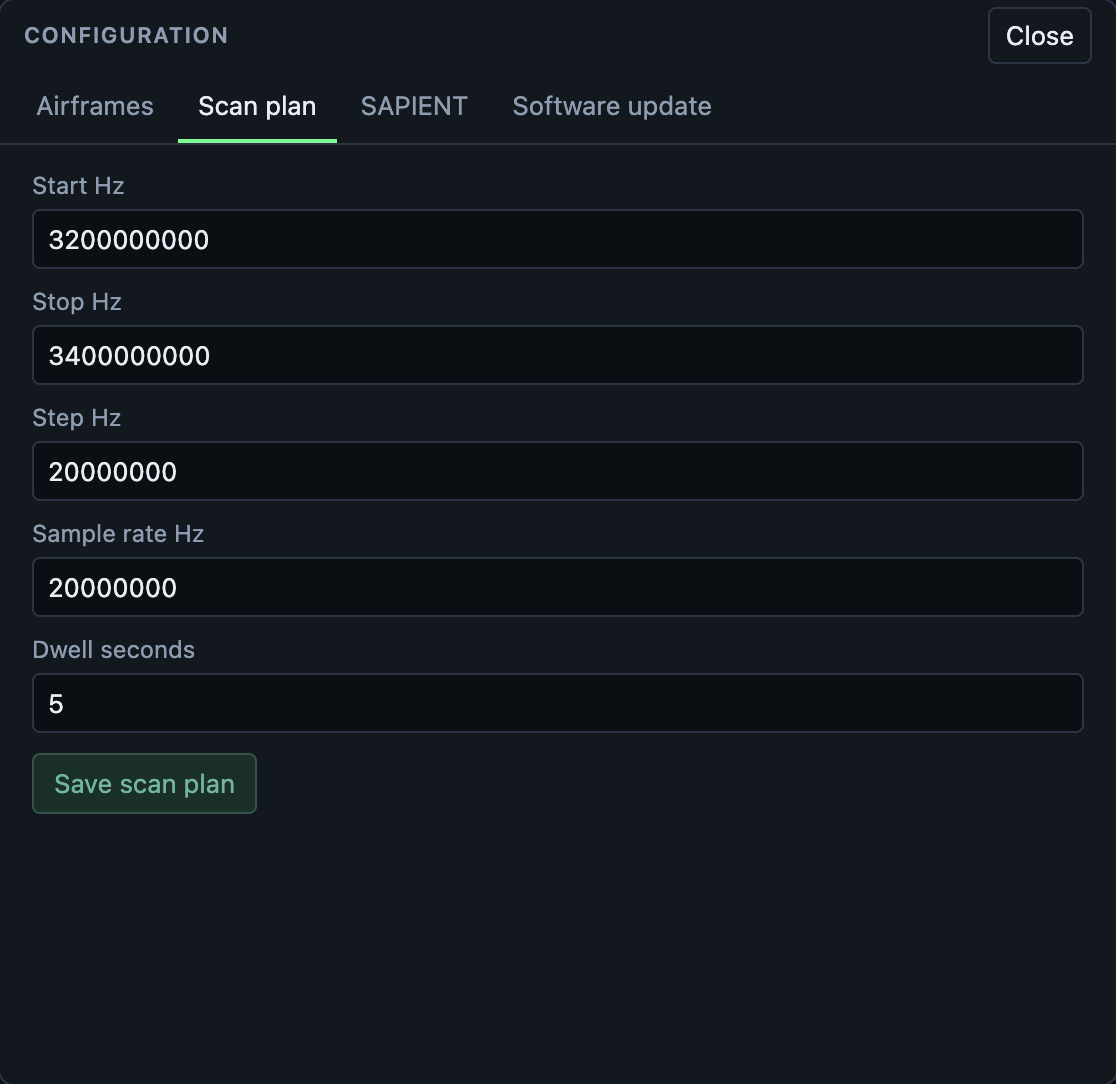
The fields are Start Hz, Stop Hz, Step Hz, Sample rate Hz, and Dwell seconds. They show the plan the controller has stored. Save scan plan stores the stops every accepted probe walks. The status line then reads "Scan plan stored. Each probe stays pending until it reports this configuration." Each accepted row shows configuration pending until that report arrives.
While you are editing a field, the refresh leaves that field as you typed it.
SAPIENT
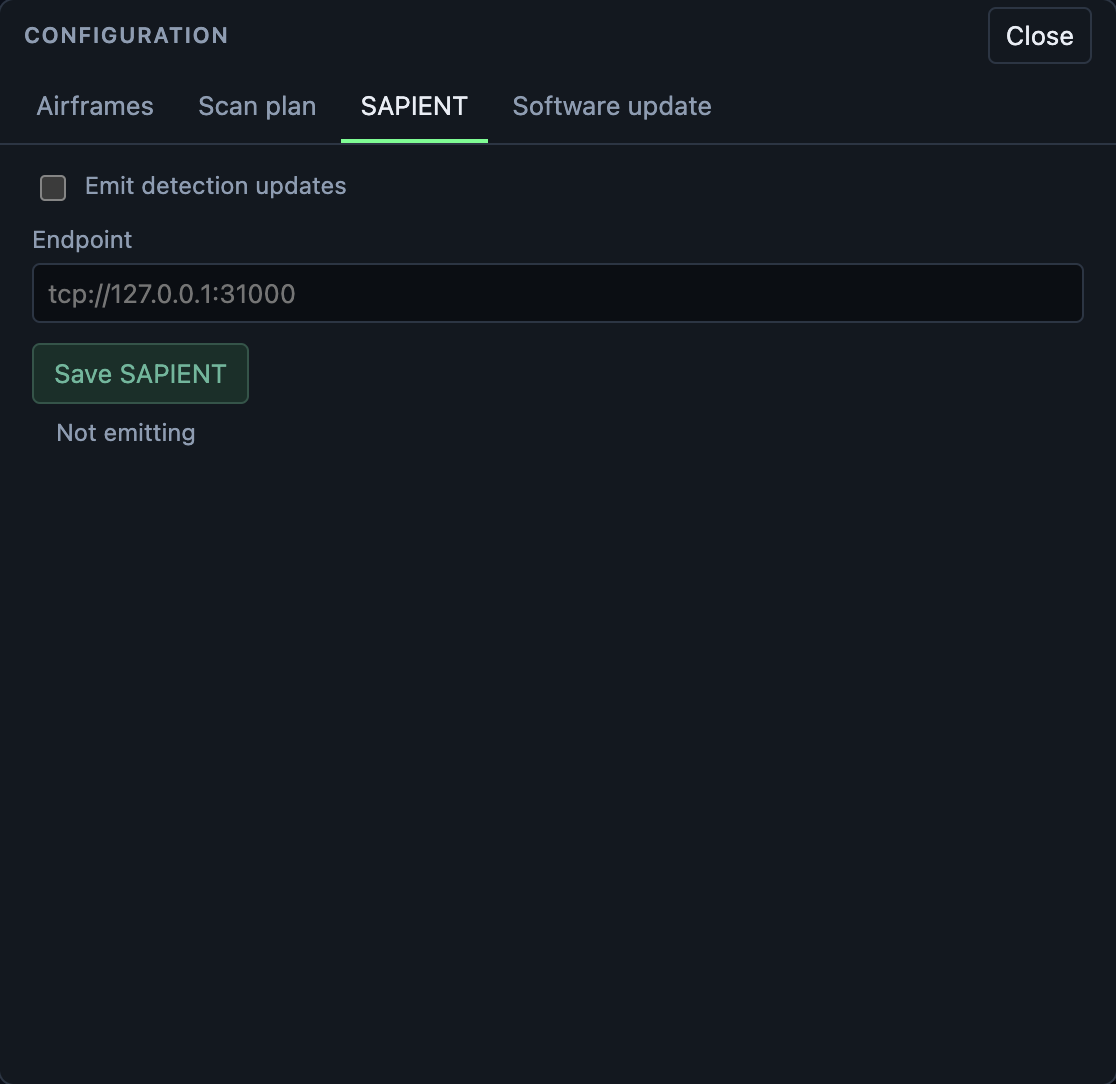
Emit detection updates is a checkbox. Endpoint is the address. The placeholder is tcp://127.0.0.1:31000, the usual local plotting server. Save SAPIENT stores both.
The status line reads Emitting, and the endpoint state, while updates are going out, and Not emitting while they are waiting. An http:// or https:// endpoint receives one JSON message. A tcp://host:port endpoint receives a SAPIENT message.
Software update
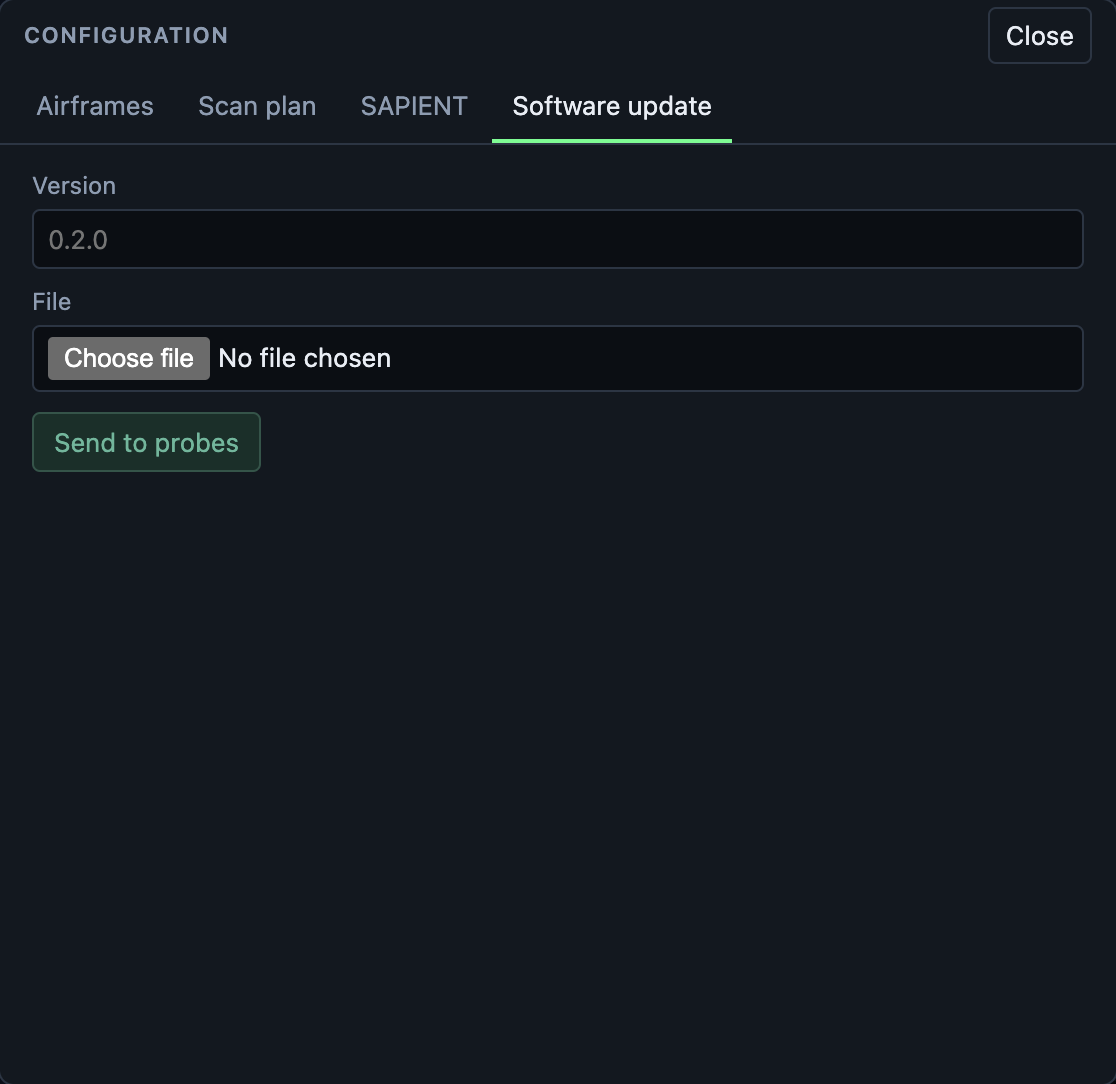
Version is a text field, with 0.2.0 as the placeholder. File is a file chooser. Send to probes stages that version and that file.
If either is missing, the status line reads "Choose a version and a file." After a successful send it reads Staged, the version, and that each probe reconnects and reports its version before the update is confirmed. On later visits the line reads Staged, the version, and the size in bytes.
Each accepted probe whose reported version differs is offered the file. The probe stores it and keeps running the program it was started with. The row shows update pending until a later contact reports that version, and the tooltip then shows update confirmed.
View
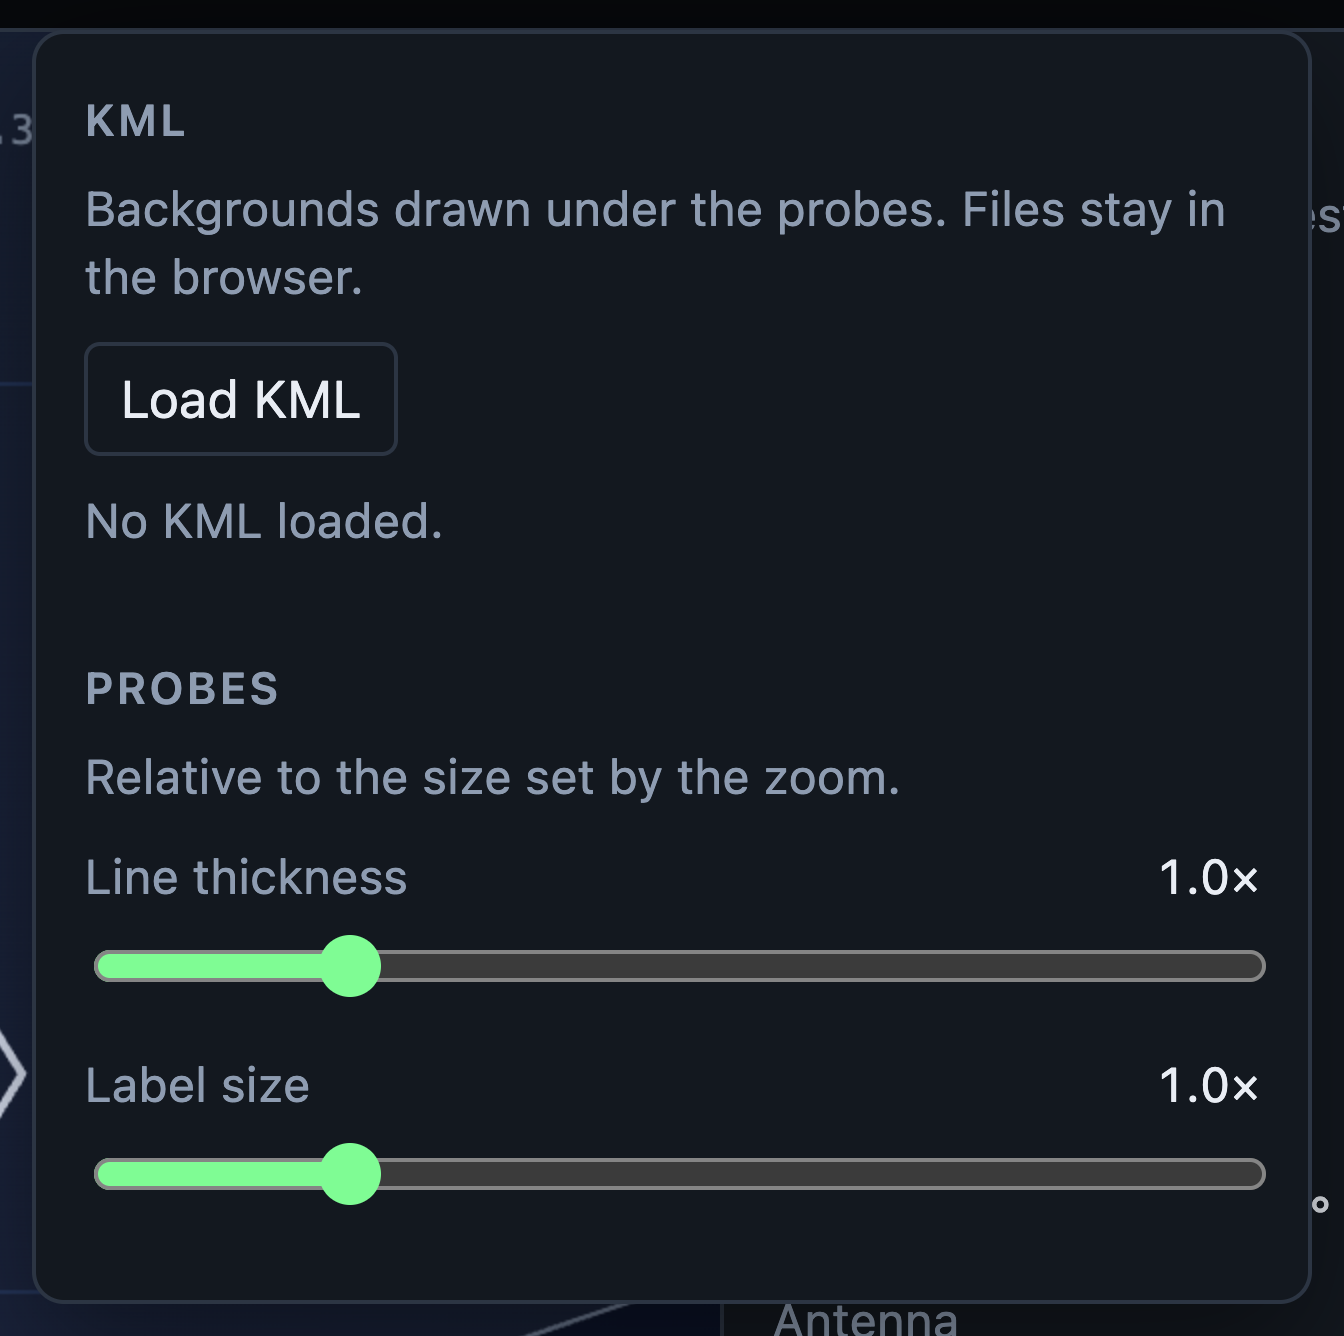
View opens a menu under the button. Press View again, press elsewhere on the page, or press Escape, and the menu closes. The layers and the sliders stay as you set them for this visit. They are kept in this browser only, and a later visit starts without the KML and with the sliders at 1.0×.
KML
The KML section is headed KML, with the hint "Backgrounds drawn under the probes. Files stay in the browser." Load KML reads one or more .kml files. Each file becomes a layer named after the file, with an Unload button. The list reads No KML loaded. until the first file. Loading a file with the same name replaces that layer. Unload removes that layer.
A file larger than 20 MB is left out, and the menu names it. A file with no geometry, or with more than 200000 points, is left out the same way. Layers are drawn on top of the wireframe and underneath the probes and the exercise.
Probe graphics
The Probes section of the menu has the hint "Relative to the size set by the zoom." Line thickness and Label size are sliders from 0.5× to 3×, in steps of 0.1×. The value beside each label updates as you drag, and the map redraws immediately. Line thickness scales the antenna outline, the aircraft mark, and the selection bracket. Label size scales the probe id beside the mark.
Simulate mesh
Simulate mesh, at the foot of the probe list, runs an exercise of four airframes over London. Their probe ids are probe-sim-1 through probe-sim-4. The button then reads Stop simulation, and the status under the list reads "Simulated probes are flying over London." The map draws the exercise in place: an amber area, a blue bearing wedge, or a green point, and a red mark labelled mesh. The map status names the exercise, including the area label when there is one. Each simulated row is marked simulated.
Stop simulation ends new simulated reports and leaves the probes already stored. The status reads Simulation stopped. After a restart the exercise is off until you turn it on again.
Updated about 10 hours ago