
User Guide: Dashboard
Overview
The Dashboard provides a real-time, browser-based view into LTE S1 events, devices, alerts, rules, maps, and related tools. It is served by the analyzer backend and requires no separate installation.
This guide explains how to use the Dashboard effectively: navigation, live data panels, search, rules management, map layers, and KML/POI features.
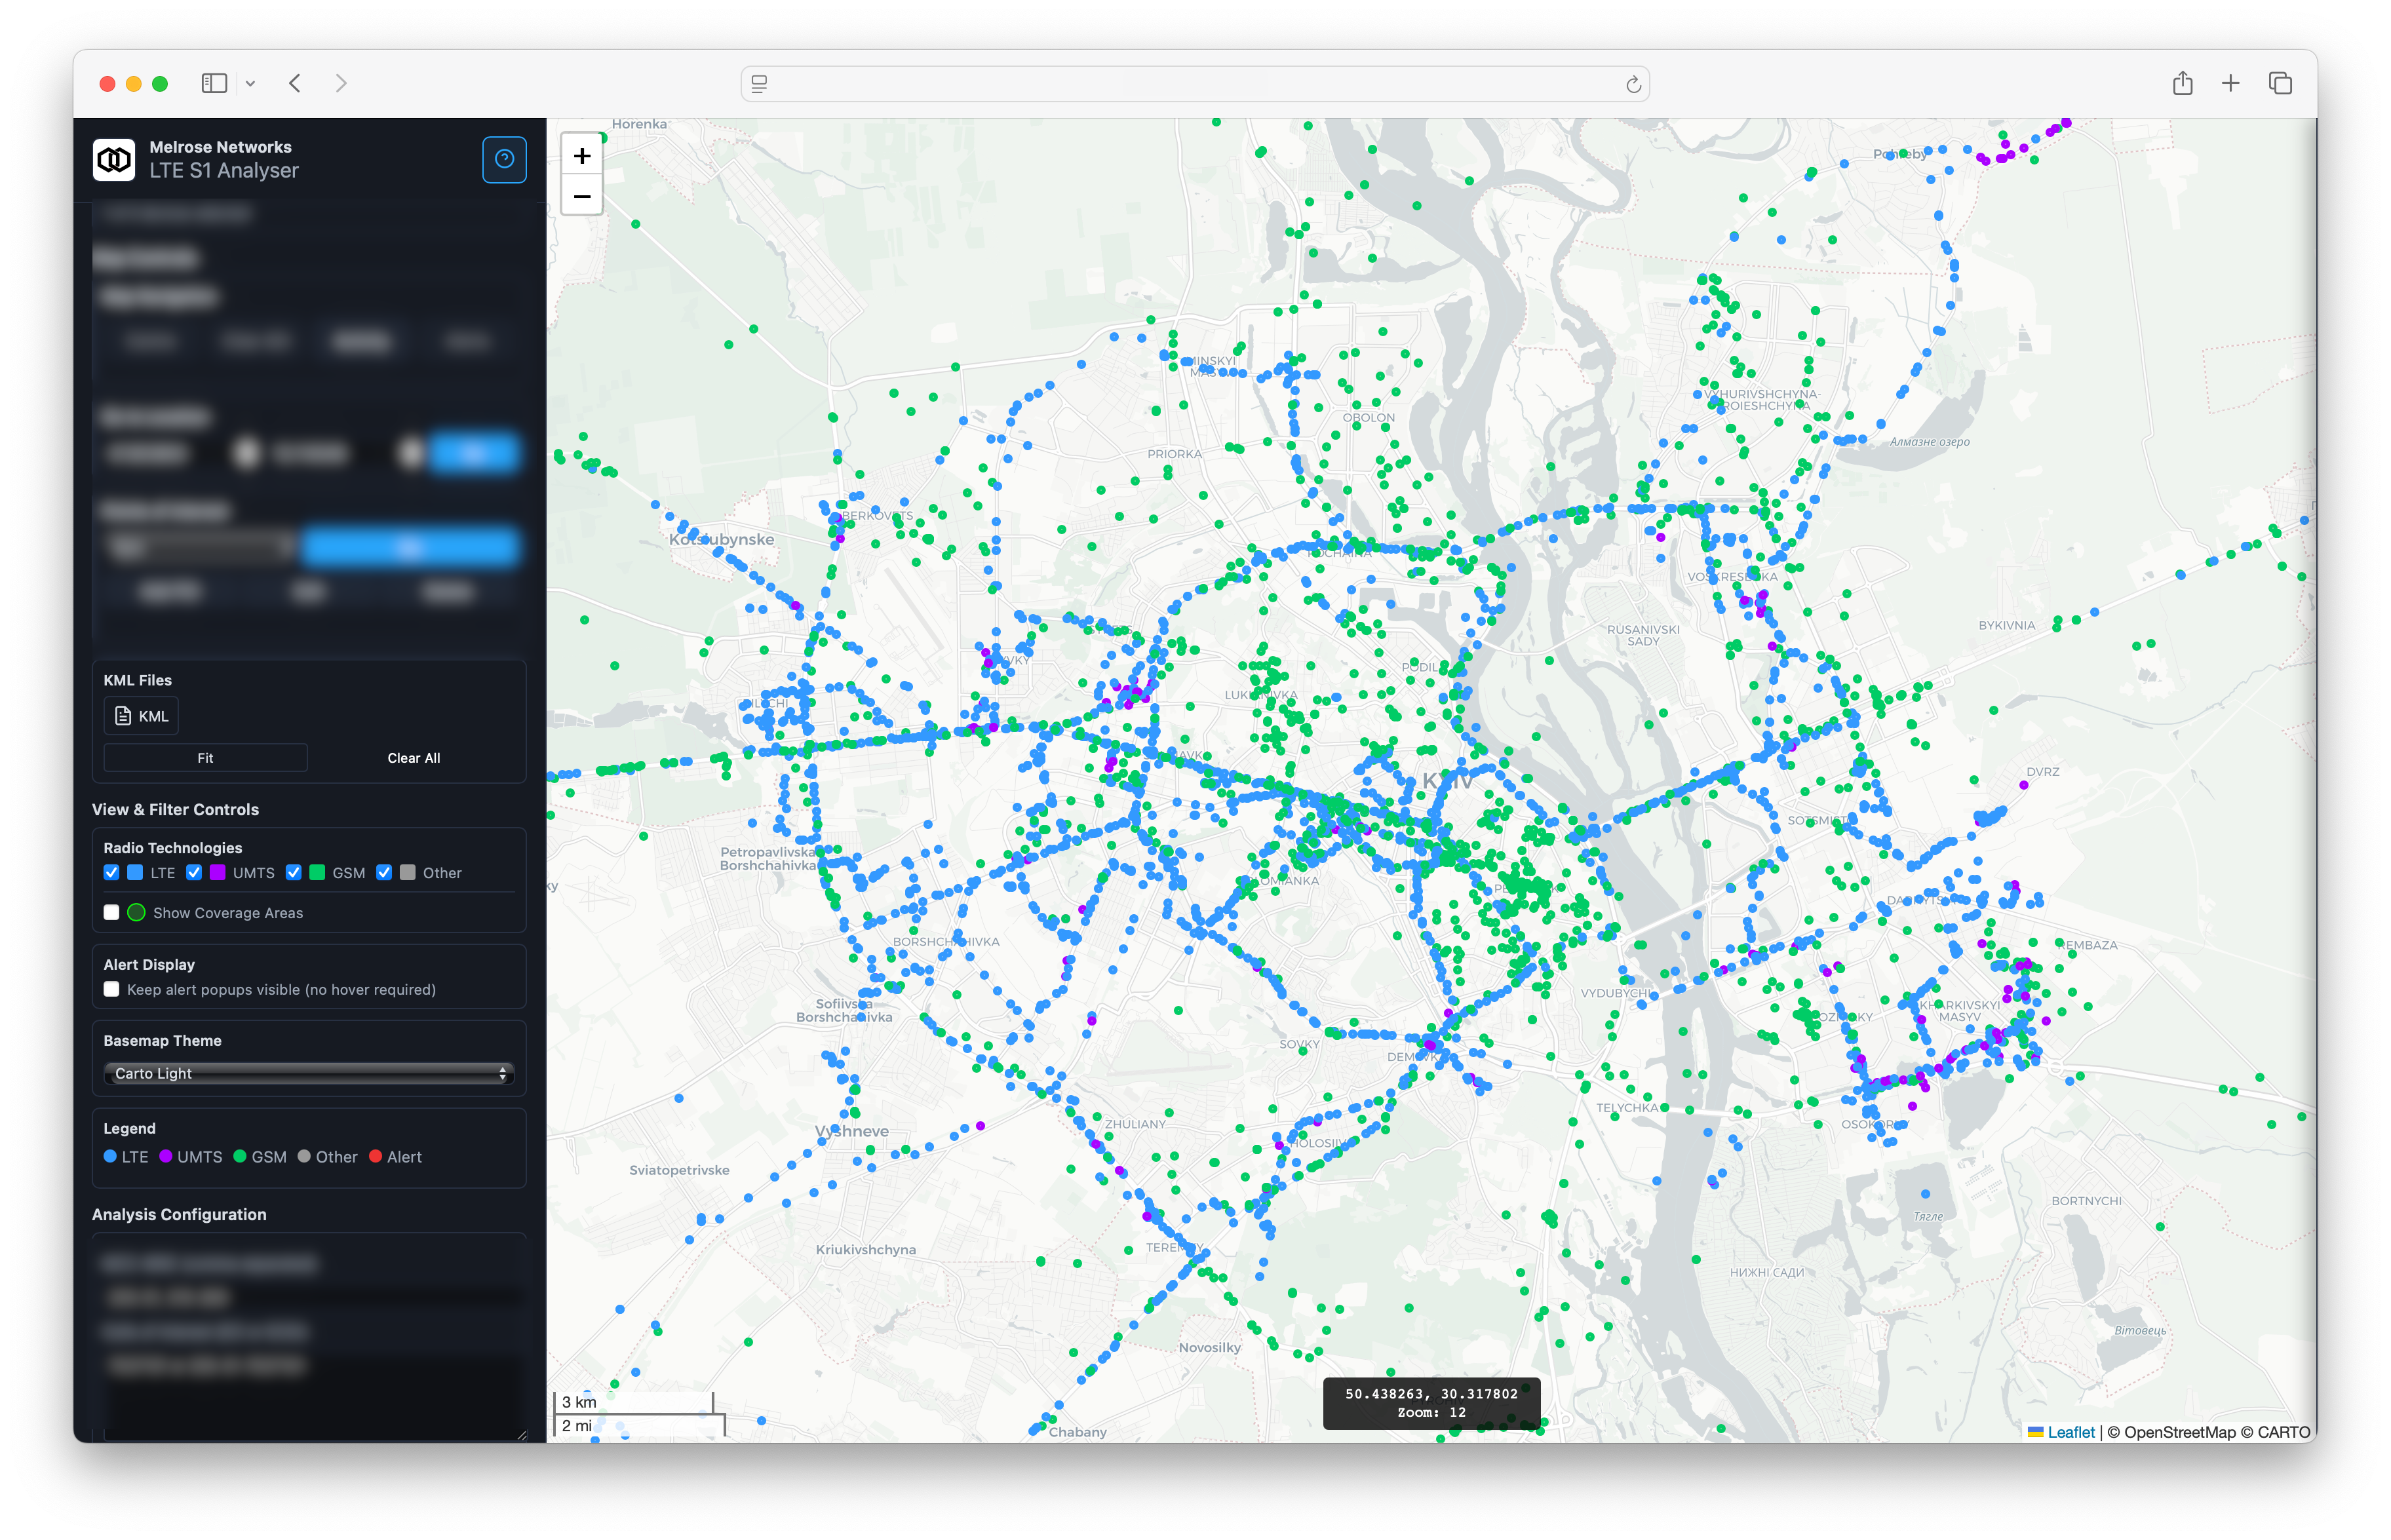
Dashboard (zoomed to show cell site location)
Quick Start
- Open the Dashboard URL provided by your deployment.
- The dashboard loads with the map, sidebar, and top navigation.
- Confirm live data by observing Events/Alerts counters. Use the map to pan/zoom.
Navigation & Layout
- Sidebar: Expandable sections with tools and status. Includes Rules, Layers, POIs, and Help (if enabled).
- Map: Central workspace to visualize cells, TAC clusters/shapes, device activity, alerts, POIs, and optional KML overlays.
- Top Notifications: Colored banners may appear to indicate system status or important actions.
Live Data Panels
- Events: Shows recent S1AP/LTE events. Use provided filters (time, message type, device) if available in your build.
- Alerts: Lists current and recent alerts generated by rules and ML. Click an alert to focus related locations or devices on the map.
- Devices: Displays active devices and summaries. Selecting a device reveals recent activity and locations.
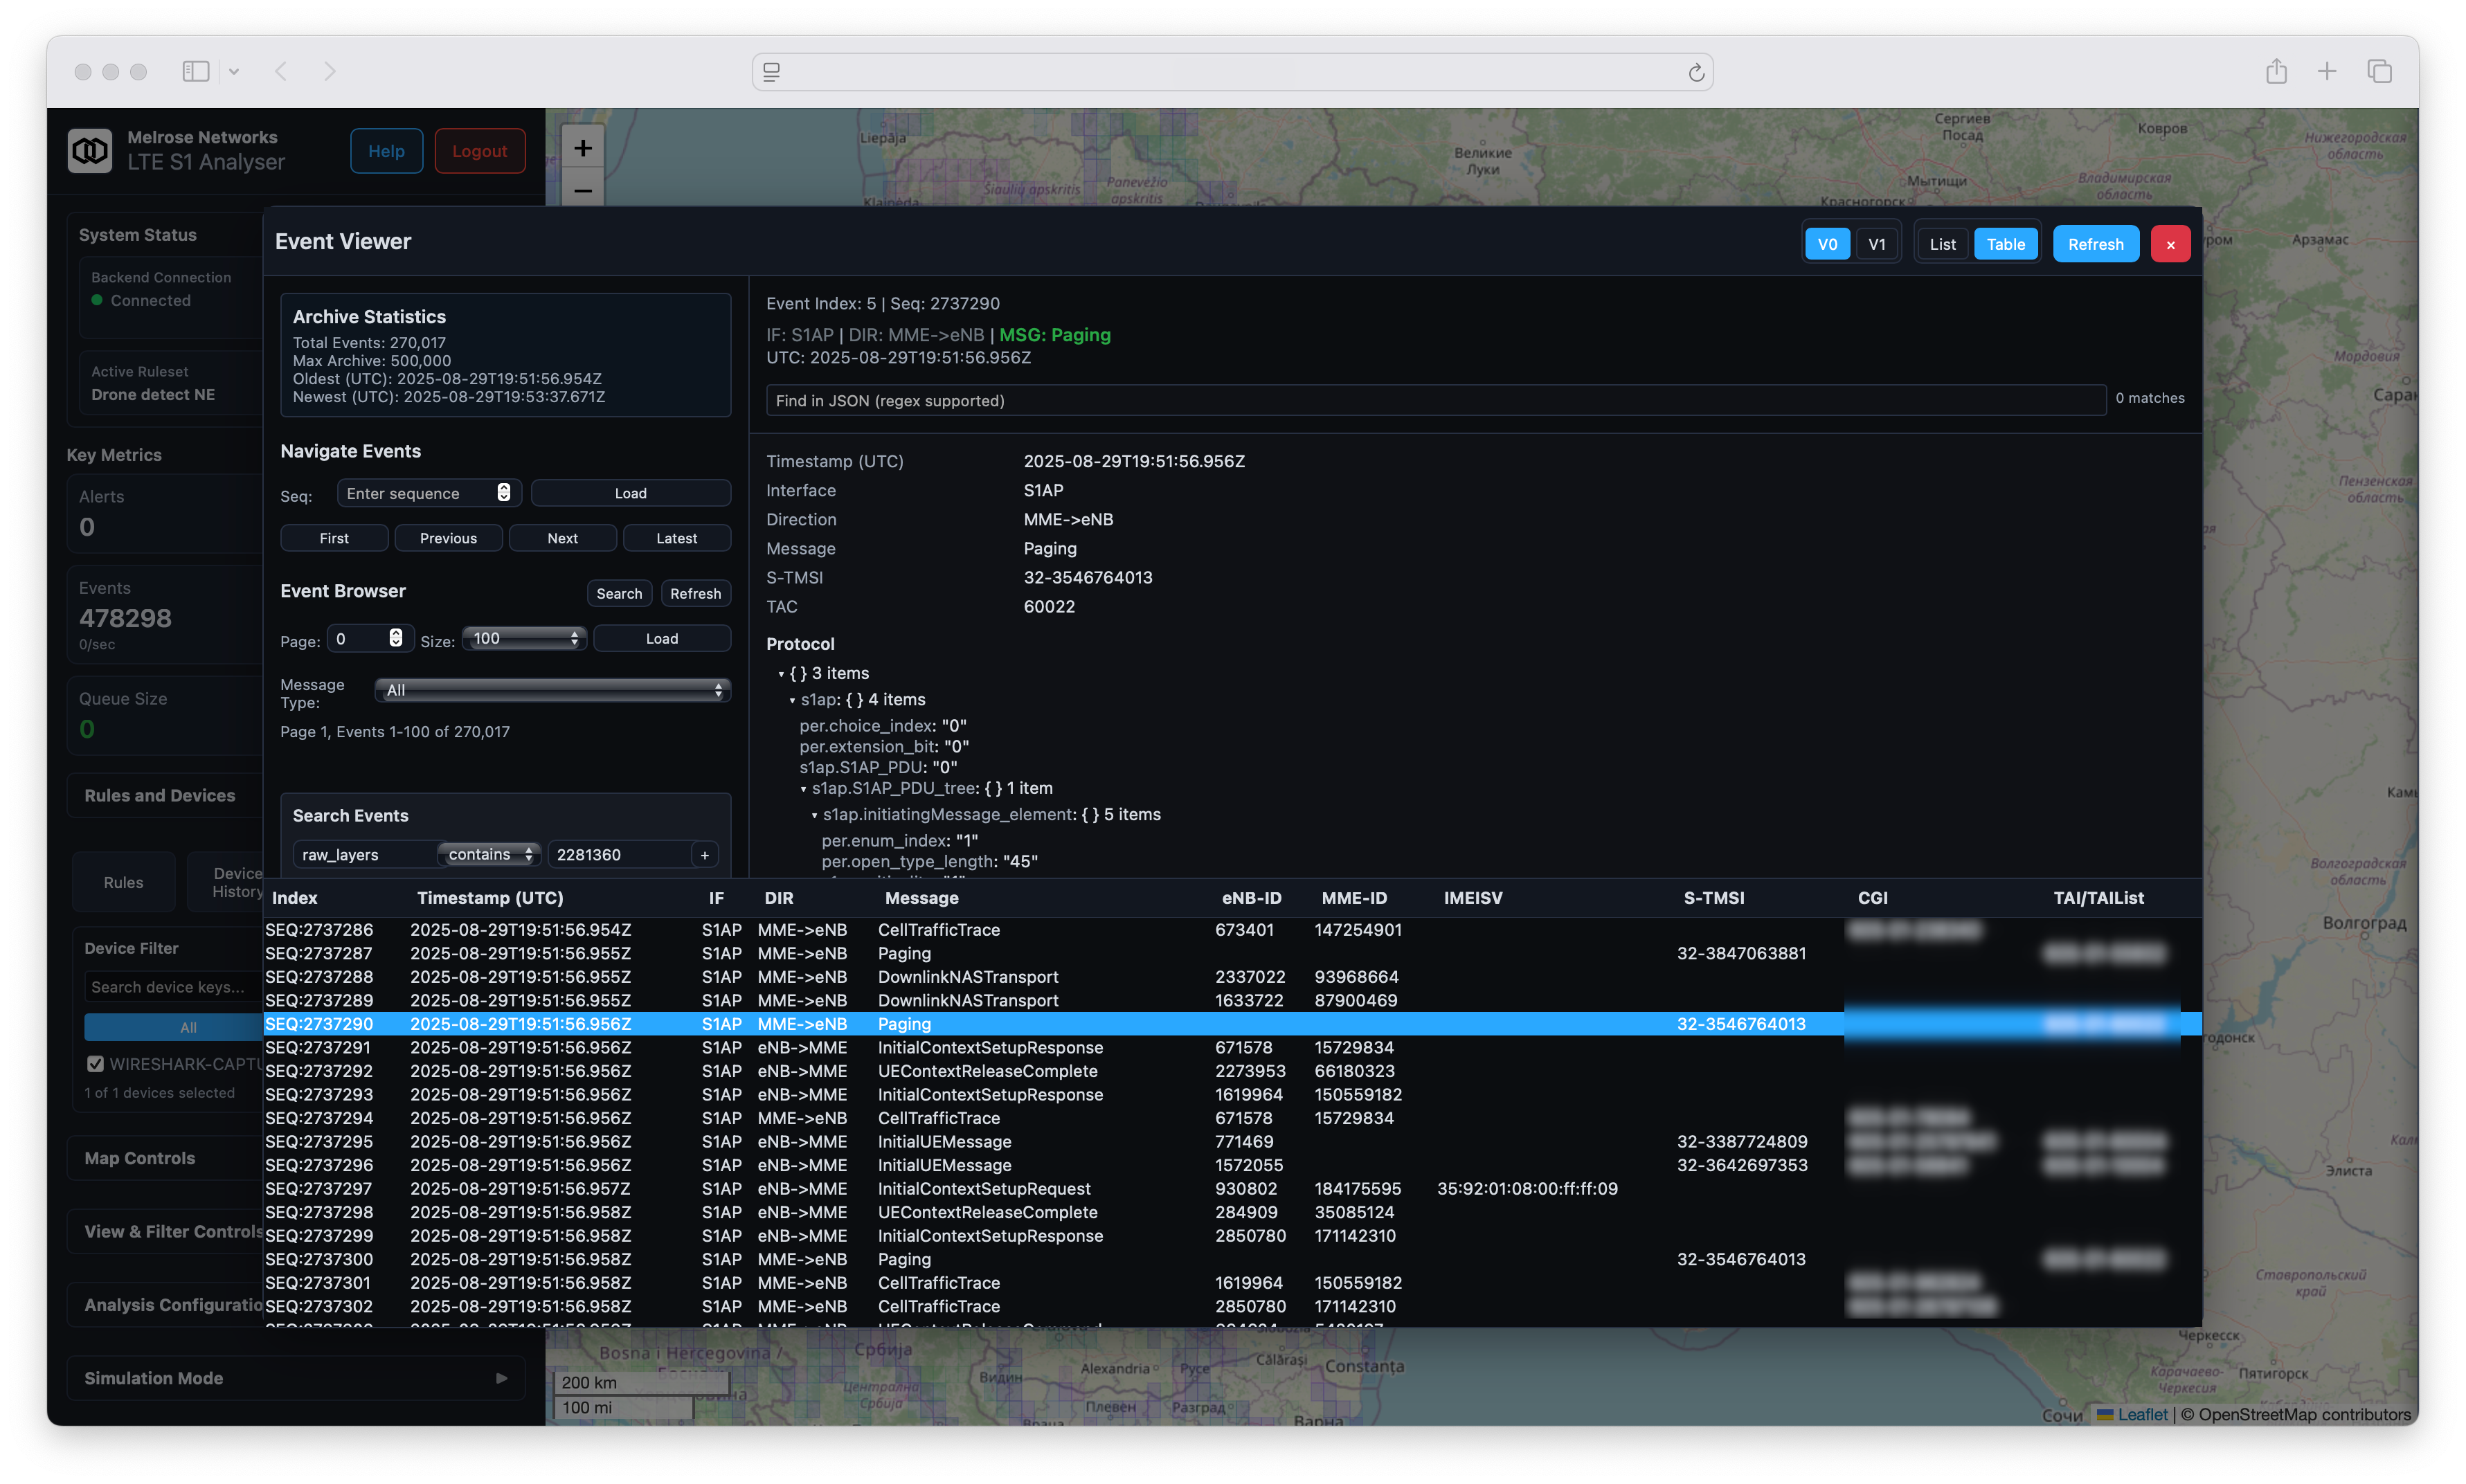
Events
Tips:
- Use the map to spatially filter: pan/zoom updates what is requested for display.
- If your deployment shows a queue size indicator, persistent growth may indicate upstream ingestion issues.
Map Data & Layers
- Toggle layers in the sidebar to show/hide: cells, TAC clusters, TAC shapes, device paths, alerts, POIs, KML overlays.
- Use bounding and zoom thoughtfully: for wide areas, enable clustered/binned layers to maintain responsiveness.
- You can locate specific identifiers (e.g. MCC/MNC/ECI, TAC) via the search/locate UI if present. The map will center on the match and display details.
Performance tips:
- Prefer cluster/summary layers when zoomed out; switch to detailed cells as you zoom in.
- Limit technologies or message types via filters to reduce visual noise.
Points of Interest (POIs)
Save and manage important map locations for quick access.
- Create a POI from the map context or the POIs panel (name, optional description).
- Update a POI by selecting it and editing details.
- Delete POIs you no longer need.
Best practices:
- Keep names concise and consistent (e.g. City - Site - Purpose).
- Ensure coordinates reflect the intended centroid; adjust zoom level for the default view.
KML Overlays
Overlay mission areas, boundaries, or routes.
- Upload: Use the KML panel to select a
.kmlfile from your computer. - Toggle: Enable/disable individual overlays from the list.
- Download/Delete (if enabled): Manage existing overlays from the same panel.
Notes:
- Large or highly complex KMLs may impact performance; consider simplifying geometry.
Rules Management
Define and manage rules that power alerting.
- View current working rules and see which named ruleset is active.
- Edit the working rules text in the editor panel.
- Save as a named ruleset to version your work.
- Apply a ruleset to make it active for new incoming events.
- Reset rule hit statistics if you want to measure fresh impact after changes.
Typical workflow:
- Edit rules in the editor pane and preview logic.
- Save as a new named version.
- Apply the ruleset; confirm new alerts behave as expected.
ML Features (if enabled)
- Status panel shows model availability and recent performance indicators.
- Training: Provide a training data source via the UI and optional parameters.
- Prediction: Select a device to view inference on its recent sequence.
Event Injection (Testing)
Inject test events directly from the dashboard to validate rules and flows.
- Open the Event Injection tool from the sidebar.
- Choose a template (e.g. InitialUEMessage) or select Custom JSON.
- Click Validate to check JSON structure.
- Click Inject to send the event; a status message confirms success or failure.
Tip: Start with templates, then tailor fields like timestamps, IDs, or locations for your scenario.
Platform Operations
Administrative actions may be available depending on your permissions.
- Reset Platform: Clears events, statistics, and simulation data; the UI will refresh to a clean state.
- Restart Platform: Stops and restarts services; the dashboard becomes temporarily unavailable and will reload automatically when ready.
Caution: Reset and Restart are disruptive. Use during demonstrations or after large configuration changes.
Archives & Search
Explore historical events if your deployment enables archiving:
- Use the Archives panel to page through historical data with adjustable page sizes.
- Apply search filters (time range, device, message types, locations) to find relevant records.
- Optionally replay a subset against a test ruleset to compare alerting behavior.
Configuration (if exposed)
A configuration panel may allow safe updates to selected settings. Changes are validated and applied by the backend; the UI reflects updated configuration after save.
Monitoring & Metrics
Some deployments surface a lightweight metrics view (e.g. total events processed, duplicates, active alerts). Use this as a health signal along with any external monitoring.
Troubleshooting
- No data visible: verify data source is active; if a queue size indicator exists and keeps growing, check upstream ingestion.
- Slow map rendering over large regions: zoom in or enable clustering/binned layers.
Keyboard & UX Notes
- Map supports standard pan/zoom via mouse and trackpad.
- Modal dialogs close with the × button or by clicking outside the modal.
Security Considerations
- Only upload KML files from trusted sources.
- Keep rules and event injection access limited to authorised users.